GitHub Circular Graph
GitHub Contribution Graph Reinterpretation.
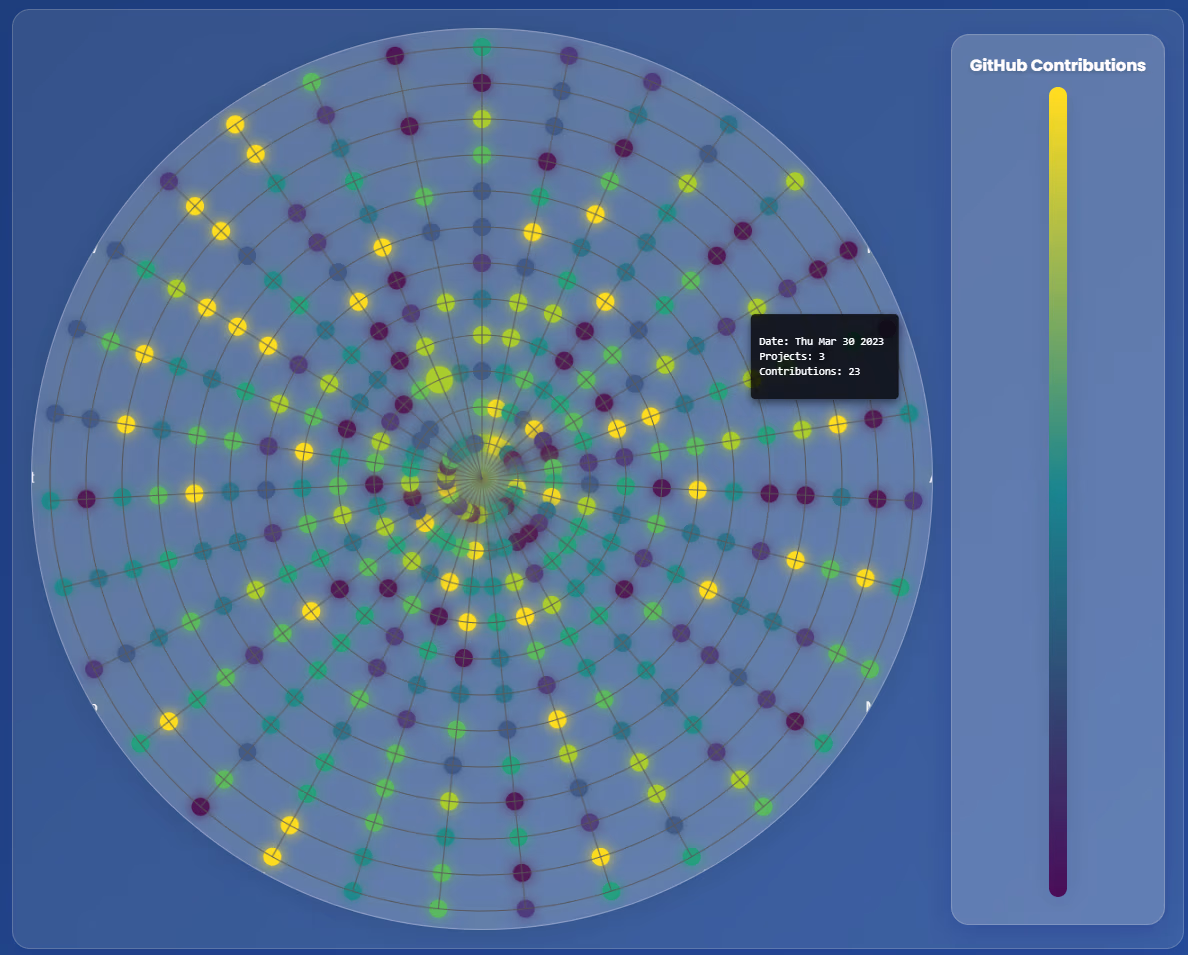
Section titled “GitHub Contribution Graph Reinterpretation.”- Each circunference is a month from inner cirfunference, January, to outer circunference, December.
- Each circle represent a day in the month.
- Each circle can be hovered to show a tooltip with stats
- It could be easily adapt to get data from github, nowadays It used random data.
Note: This was an AI experiment after set up local LLMs, and push the LLMs until get a UI previously imagined.
Reactjs code
Section titled “Reactjs code”import React, { useEffect, useRef, useState } from 'react';import './App.css';// Sample data generationconst generateSampleData = () => { const startDate = new Date(2023, 0, 1); const endDate = new Date(2023, 11, 31); const data = []; const oneDay = 24 * 60 * 60 * 1000; for (let date = startDate; date <= endDate; date = new Date(date.getTime() + oneDay)) { data.push({ date: new Date(date), count: Math.floor(Math.random() * 9) + 1, projects: Math.floor(Math.random() * 5) + 1, totalContributions: Math.floor(Math.random() * 50) + 1, stats: `Stats for ${date.toDateString()}` // Add more relevant stats here }); } return data;};
const data = generateSampleData();
// List of random words
const App = () => { const canvasRef = useRef(null); const [tooltip, setTooltip] = useState({ visible: false, content: '', x: 0, y: 0 }); const [hoveredCircle, setHoveredCircle] = useState(null);
useEffect(() => { const canvas = canvasRef.current; const ctx = canvas.getContext('2d'); const width = canvas.width; const height = canvas.height; const radius = Math.min(width, height) / 2 - 20; const centerX = width / 2; const centerY = height / 2;
const drawHeatmap = (data) => { ctx.clearRect(0, 0, width, height);
const monthNames = ['Jan', 'Feb', 'Mar', 'Apr', 'May', 'Jun', 'Jul', 'Aug', 'Sep', 'Oct', 'Nov', 'Dec']; const maxDays = 31; const months = 12; const colorScale = ['#440154', '#472D7B', '#3B518B', '#2C718E', '#21908C', '#27AD81', '#5CC863', '#AADC32', '#FDE725'];
data.forEach(item => { const date = item.date; const count = item.count;
const angle = (date.getDate() - 1) / maxDays * 2 * Math.PI - Math.PI / 2; const monthRadius = (date.getMonth() + 1) / months * radius;
ctx.beginPath(); ctx.arc(centerX + monthRadius * Math.cos(angle), centerY + monthRadius * Math.sin(angle), 10, 0, 2 * Math.PI); ctx.closePath();
const color = colorScale[count - 1]; ctx.fillStyle = color; ctx.shadowColor = color; ctx.shadowBlur = 15; ctx.fill();
ctx.fillStyle = '#fff'; ctx.font = '10px Arial'; ctx.textAlign = 'center'; ctx.textBaseline = 'middle';
});
if (hoveredCircle) { const { item, x, y } = hoveredCircle; const date = item.date; const count = item.count;
const angle = (date.getDate() - 1) / maxDays * 2 * Math.PI - Math.PI / 2; const monthRadius = (date.getMonth() + 1) / months * radius;
ctx.beginPath(); ctx.arc(centerX + monthRadius * Math.cos(angle), centerY + monthRadius * Math.sin(angle), 15, 0, 2 * Math.PI); ctx.closePath();
const color = colorScale[count - 1]; ctx.fillStyle = color; ctx.shadowColor = color; ctx.shadowBlur = 20; ctx.fill();
ctx.fillStyle = '#fff'; ctx.font = '10px Arial'; ctx.textAlign = 'center'; ctx.textBaseline = 'middle';
setTooltip({ visible: true, content: `Date: ${date.toDateString()} \nProjects: ${item.projects} \nContributions: ${item.totalContributions}`, x: x, y: y }); }
for (let i = 0; i < months; i++) { const angle = i / months * 2 * Math.PI - Math.PI / 2; const labelX = centerX + (radius + 30) * Math.cos(angle); const labelY = centerY + (radius + 30) * Math.sin(angle);
ctx.fillStyle = '#fff'; ctx.textAlign = 'center'; ctx.textBaseline = 'middle'; ctx.font = '16px Arial'; ctx.fillText(monthNames[i], labelX, labelY); }
for (let i = 1; i <= months; i++) { ctx.beginPath(); ctx.arc(centerX, centerY, (i / months) * radius, 0, 2 * Math.PI); ctx.strokeStyle = '#555'; ctx.lineWidth = 1; ctx.stroke(); }
for (let i = 0; i < maxDays; i++) { const angle = i / maxDays * 2 * Math.PI - Math.PI / 2; ctx.beginPath(); ctx.moveTo(centerX, centerY); ctx.lineTo(centerX + radius * Math.cos(angle), centerY + radius * Math.sin(angle)); ctx.strokeStyle = '#555'; ctx.lineWidth = 1; ctx.stroke(); } };
drawHeatmap(data);
const handleMouseMove = (event) => { const rect = canvas.getBoundingClientRect(); const mouseX = event.clientX - rect.left; const mouseY = event.clientY - rect.top; const maxDays = 31; const months = 12; let found = false; data.forEach(item => { const date = item.date; const count = item.count; const angle = (date.getDate() - 1) / maxDays * 2 * Math.PI - Math.PI / 2; const monthRadius = (date.getMonth() + 1) / months * radius; const x = centerX + monthRadius * Math.cos(angle); const y = centerY + monthRadius * Math.sin(angle); const dx = mouseX - x; const dy = mouseY - y; if (dx * dx + dy * dy < 100) { setHoveredCircle({ item, x: event.clientX, y: event.clientY }); found = true; } });
if (!found) { setHoveredCircle(null); setTooltip({ visible: false, content: '', x: 0, y: 0 }); }
drawHeatmap(data); };
canvas.addEventListener('mousemove', handleMouseMove); return () => { canvas.removeEventListener('mousemove', handleMouseMove); }; }, [hoveredCircle]);
return ( <div className="heatmap-container"> <canvas ref={canvasRef} width="1000" height="1000"></canvas> {tooltip.visible && ( <div className="tooltip" style={{ left: tooltip.x + 10, top: tooltip.y + 10 }}> <pre>{tooltip.content}</pre> </div> )} <div className="legend"> <h3>GitHub Contributions</h3> <div className="color-bar"></div> <div className="labels"> </div> </div> </div> );};export default App;body { display: flex; justify-content: center; align-items: center; height: 100vh; background: linear-gradient(135deg, #1e3c72, #2a5298); color: #fff; margin: 0;}
.heatmap-container { display: flex; align-items: center; background: rgba(255, 255, 255, 0.1); border-radius: 20px; padding: 20px; box-shadow: 0 8px 32px 0 rgba(31, 38, 135, 0.37); backdrop-filter: blur(10px); -webkit-backdrop-filter: blur(10px); border: 1px solid rgba(255, 255, 255, 0.18); position: relative;}
canvas { border: 2px solid rgba(255, 255, 255, 0.25); box-shadow: 0 4px 30px rgba(0, 0, 0, 0.1); border-radius: 50%; background-color: rgba(255, 255, 255, 0.1); backdrop-filter: blur(5px); -webkit-backdrop-filter: blur(5px);}
.legend { margin-left: 20px; display: flex; flex-direction: column; align-items: center; background: rgba(255, 255, 255, 0.1); border-radius: 20px; padding: 20px; box-shadow: 0 8px 32px 0 rgba(31, 38, 135, 0.37); backdrop-filter: blur(10px); -webkit-backdrop-filter: blur(10px); border: 1px solid rgba(255, 255, 255, 0.18);}
.legend h3 { margin: 0; font-size: 18px; color: #fff; text-shadow: 0 2px 4px rgba(0, 0, 0, 0.2);}
.color-bar { width: 20px; height: 900px; background: linear-gradient(to top, #440154, #21908C, #FDE725); border-radius: 10px; margin: 10px 0; box-shadow: 0 4px 30px rgba(0, 0, 0, 0.1); backdrop-filter: blur(5px); -webkit-backdrop-filter: blur(5px);}
.labels { display: flex; justify-content: space-between; width: 100%; color: #fff; text-shadow: 0 2px 4px rgba(0, 0, 0, 0.2);}
.labels span { display: inline-block; width: 20px; text-align: center; font-weight: bold;}
.tooltip { position: absolute; background: rgba(0, 0, 0, 0.8); color: #fff; padding: 10px; border-radius: 5px; pointer-events: none; box-shadow: 0 4px 10px rgba(0, 0, 0, 0.5); font-size: 12px; line-height: 1.4; white-space: pre-wrap; z-index: 10; transform: translate(-50%, -100%);}